Your company has won a new contract and you are gearing to start the project. As a business project manager, before you chalk down the set of activities, tentative deliverables, roles & responsibilities of team members, risks, etc. it is very important to have a Kick-off meeting for the project. Kick-off meeting is an enthusiasm-generator for the customer and the team members involved in the project. As a project manager, you need to pull up your sleeves and plan activities using effective & productive project management tools so that you can focus on planning as well as execution.
One such platform is Wrike, a work management & collaboration platform used by high-performance teams. It is ideal for managing localized project teams as well as distritubuted teams. So, before you start working on your project planning, let’s have a look at some interesting tips for setting up a successful project kick-off!
Infographic brought to you by Wrike business project manager
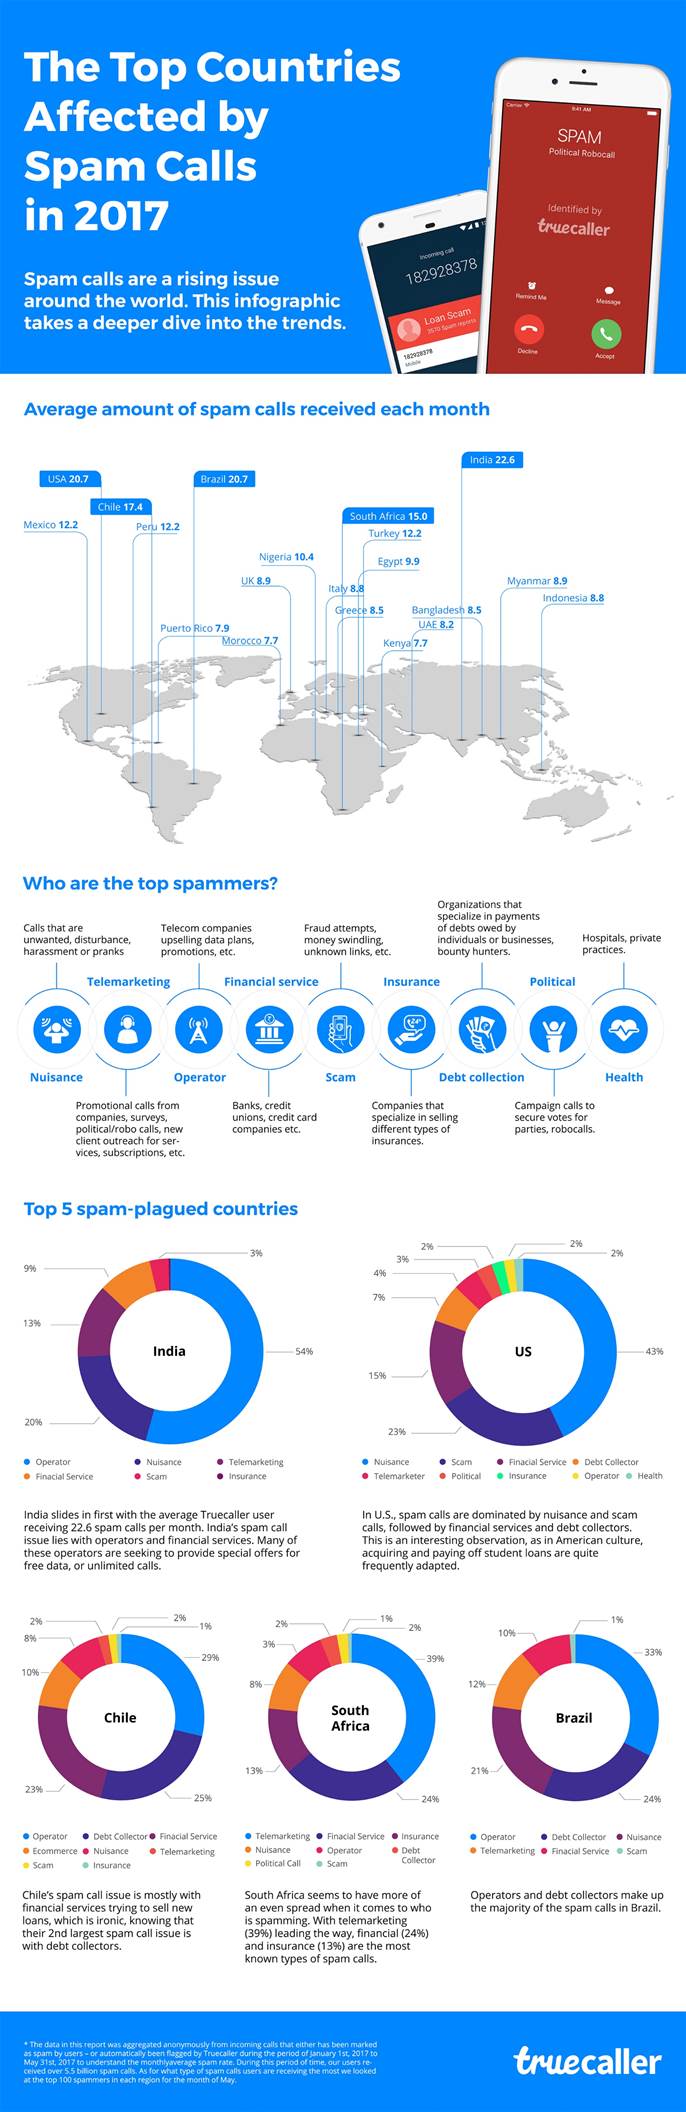
Spam calls have been on the rise ever since the advent of mobile phones. In its strive towards protecting its users from unwanted calls and potential fraud, Truecaller released a report revealing the top 20 countries that have been most affected by spam calls in 2017.
One of the revelations that came from this report was that an overwhelming majority of spam calls were received by India. According to the report, India’s topped this list because its spam call issue majorly lies with operators and financial services, most of whom are seeking to provide special offers for free data, or unlimited calls.
Tying in for second place amongst top spam-plagued countries are The United States and Brazil. The report also divulges into common categories that tie all these spam calls together. These range over, operator, debt collection, bank, political, health, spam, telemarketing, financial service, scam and insurance.
top 100 spammers in each region for the month of May.
Category Key
Nuisance: Due to this being a broad spectrum of calls, it is generally calls that is unwanted, disturbance for users, harassment, pranks.
Telemarketing: Promotional calls from companies, surveys, political/robo calls, new client outreach for services, subscriptions, etc.
Operator: Telecom companies upselling data plans, promotions, etc.
Financial service: Banks, credit unions, credit card companies etc.
Scam: Fraud attempts, money swindling, unknown links, etc.
Insurance: Companies that specialize in selling different types of insurances.
Debt collection: Organizations that specialize in payments of debts owed by individuals or businesses, bounty hunters.
Political: Campaign calls to secure votes for parties, robocalls.
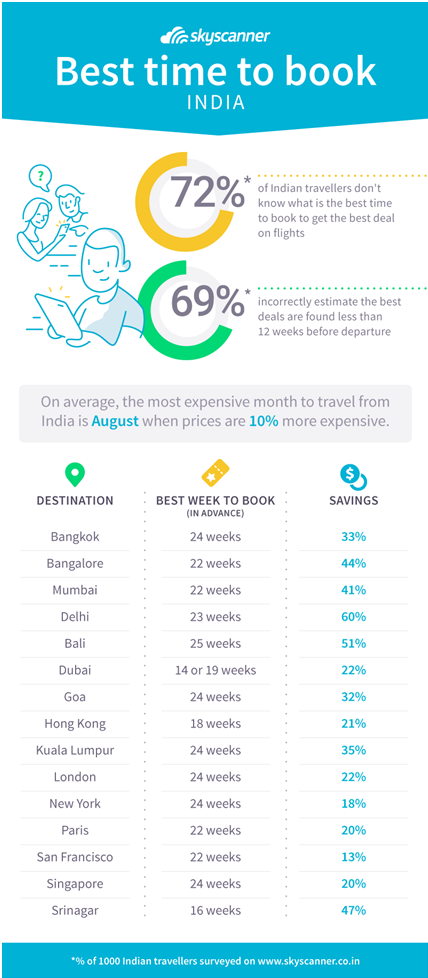
Leading global travel search engine, Skyscanner [earlier coverage here] has analysed two years’ worth of travel search data from over 60 million monthly users to answer the one questions that always puzzles travellers: When is the best time to book flights?
A recent survey of Indian travellers revealed 72% do not know when is the best time to book flights. Skyscanner’s survey further unveiled 69% of travellers incorrectly estimate the best air fares can be found less than 12 weeks before departure, when in fact the best deals are snapped up by travellers who plan in advance. Traveller’s eyeing up Bali for their summer trip can save up to 51% on flight tickets by booking 25 weeks in advance or risk paying 27% more than the average fare when they leave booking to the last minute.
The same trend appears for air fares to Indian traveller’s favourite summer destinations, traveller’s looking to vacation in Kuala Lumpur and Bangkok can grab flights for 35% and 33% less than the average fare, respectively, when booking 24 weeks prior to departure.
Skyscanner recommends booking 24 weeks in advance for travellers venturing to Europe or the USA for their summer vacations for savings of 22% and 18%, respectively.
Skyscanner also revealed the most inexpensive months to travel to visit some of Indian travellers’ favourite locations. November is the cheapest month to travel to Bangkok when flights 10% cheaper than the average fare, while visa-friendly Bali can be best enjoyed in April with a 10% saving on the average fare.
Commenting on the findings, Reshmi Roy, Senior Growth Manager, Skyscanner India said
We hope Skyscanner’s data can provide travellers with clarity on how and when to get the best deal on flights and what to expect if booking is left to the last minute. After reviewing flight prices from the last two years, we can clearly see that it pays to plan. Booking at the right time can make a huge difference to one’s expenditure on their trip, up to 51% in some cases.
About SkyScanner
Skyscanner is a leading global travel search company providing free search of flights, hotels and car hire. Founded in 2003, Skyscanner helps meet the travel planning needs of over 50 million people each month. Skyscanner’s highly-rated free mobile apps have been downloaded over 40 million times. The privately-owned company employs over 700 staff and has ten global offices in Edinburgh, London, Singapore, Beijing, Shenzhen, Miami, Barcelona, Glasgow, Sofia and Budapest. For more information, please visit Skyscanner
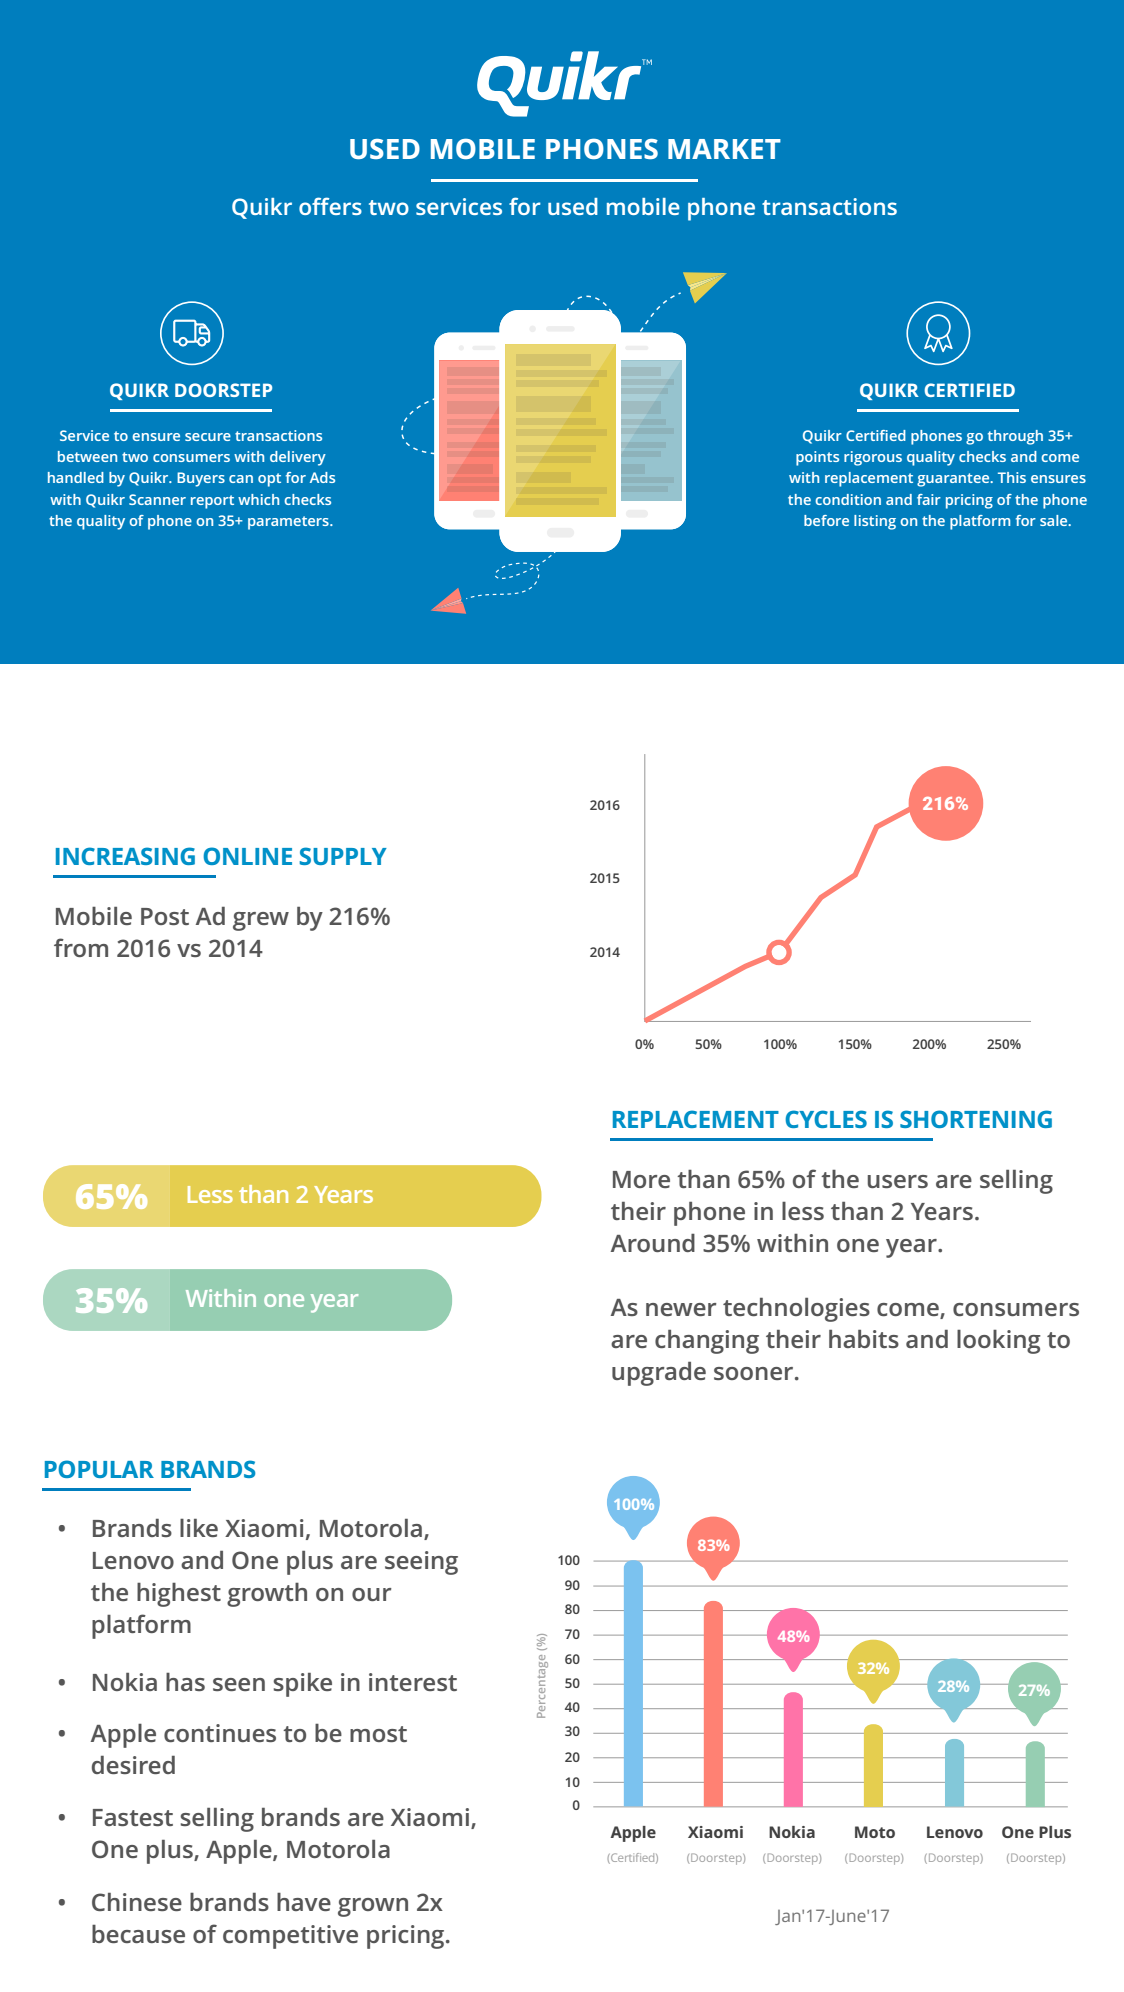
Quikr has released an interesting & insightfulreport titled ‘Usedmobilephonemarket in India’.
Some of the key highlights from the report are below:
Quikr offers two services for used mobile phone transactions : a) Quikr Doorstep: Service to ensure secure transactions between two consumers with delivery handled by Quikr b) Quikr certified: Quikr Certified phones go through 35+points rigorous quality checks and comewith replacement guarantee.
Mobile Post Ad grew by 216% from 2016 vs 2014 indicating an increase in online supply of second hand phones
As newer technologies come, consumers are changing their habits and looking to upgrade phones sooner resulting in shorter replacement cycles
The report throws light on the most preferred brands and the cities that are most active in used phone market. It also spots trends such as – 4G becoming popular, selfie phones not going out of fashion and increase in demand for high end phones.
Jigsaw Academy, India’s top online school for analytics, and Analytics Vidhya, India’s largest analytics and data science community have launched the Analytics India Industry Report 2017 – Salaries & Trends. While automation is spelling doom for IT services professionals in India [and worldwide], this report comes as a life saver to many. With the recent flurry of layoffs by major IT players, the report suggests that adding analytics skills to their kitty will not only save careers for IT professionals, but also help them get a bump in their pay.
The Indian IT industry has for the better part been services focused. While that worked a decade ago, it is no longer the need of the industry. Weighing in on this, Gaurav Vohra, CEO & Co-founder of Jigsaw Academy said
We have long talked about moving up the value chain in terms of the services we offer to the world. We now have a chance to become the intelligence hub for the world. The IT industry can transform itself into IT 2.0 by riding on the big data wave. But they need to move fast if they have to stay relevant.
The report also has extremely interesting insights on the kind of salaries currently being offered to professionals with analytics skills. The bet on Machine Learning is finally paying off and it is the best paying analytics skill in the market currently, with an average pay of Rs. 10.43 LPA, even beating Big Data to the top spot, which comes in close with an average pay of Rs. 9.93 LPA. However, what companies seem to cherish are professionals with both these skill sets, a combination which fetches a cool Rs. 13.94 LPA on an average.
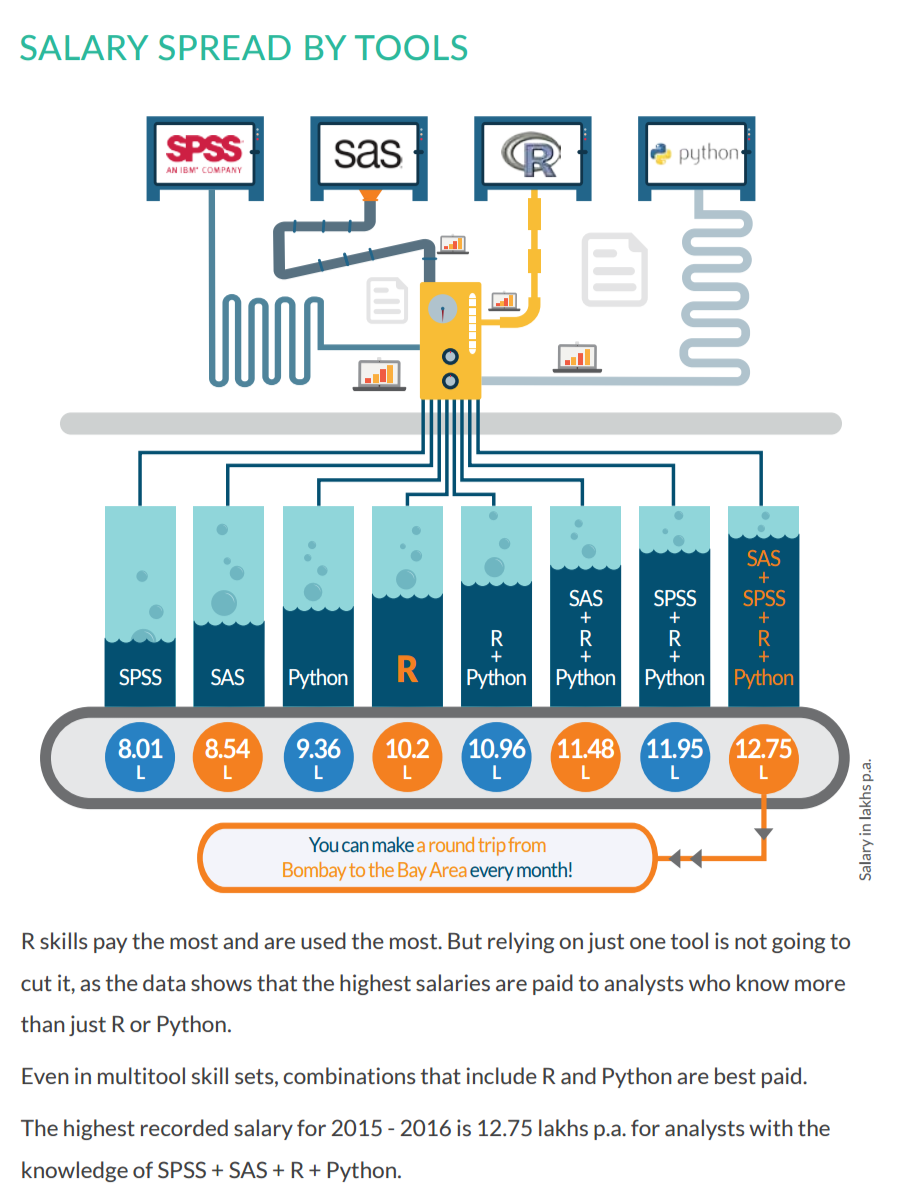
A huge change, as per the report, is the industry wide adoption and use of open source tools. In fact, for the first time this year, top tools that can help professionals get into analytics are R and Python, both of which are wildly popular open source tools. This points to the fact that popularity of expensive analytics computing software is on a steady decline. The salaries based on tools too seems to reflect this.
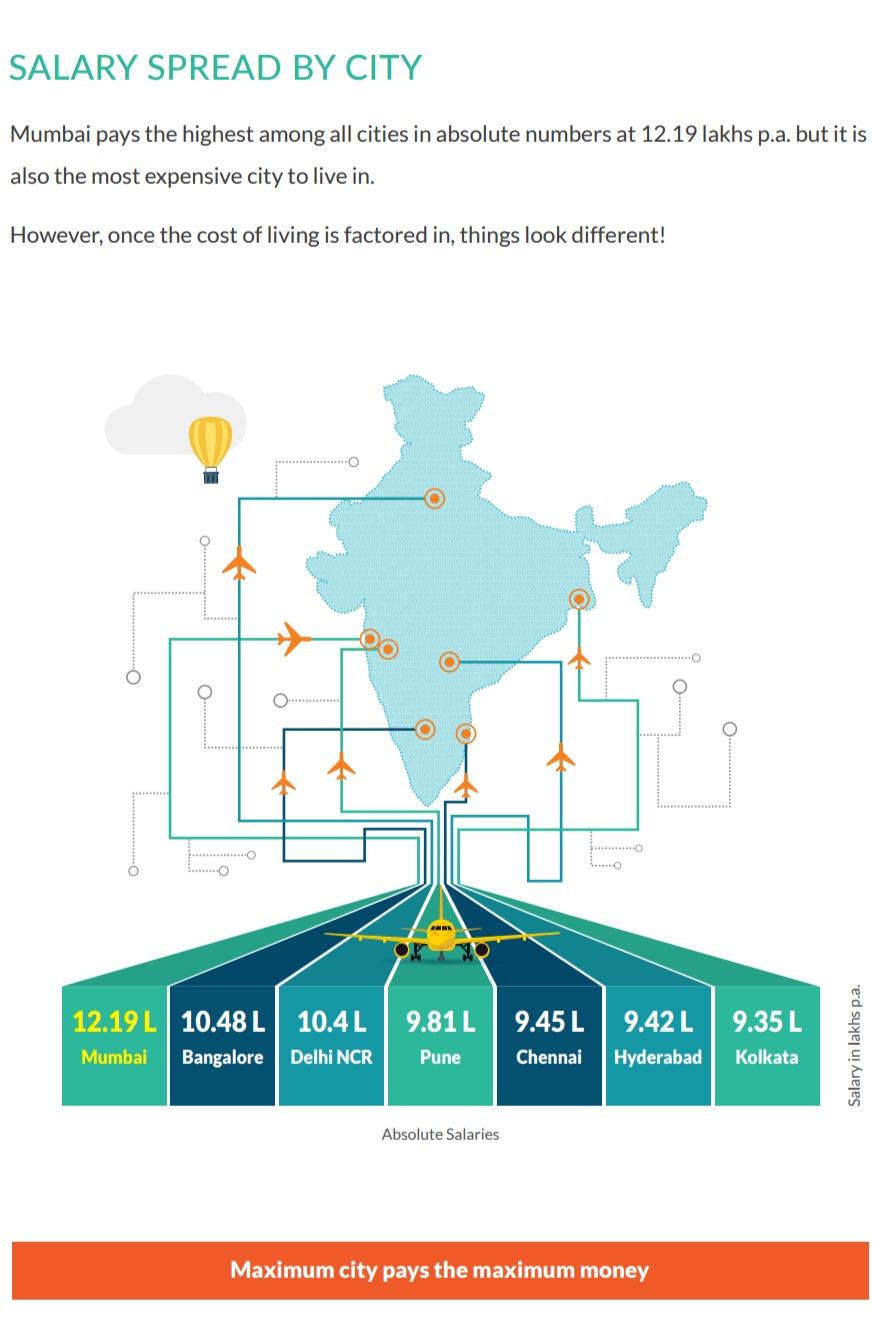
R and Python skills alone pay better than SAS, with average pay of Rs. 10.40 LPA and Rs. 10.12 LPA respectively. But here too, it is the combination of multiple skill-sets seems to pay the best. The best paid professionals are the ones with SAS + R + Python proficiency, with an average pay of Rs. 12.91 LPA. The report also includes more salary insights based on city, company size, experience, and domain.
Open source tools combined with machine learning techniques have become the focus of the industry. It is evident from the report that companies prefer people who embrace the open source ecosystem and have high agility to learn new tools and techniques-a trend we see across our competitions and job portal. Companies are looking out for well-rounded professionals who can apply Machine Learning & Big Data to solve real business problems.
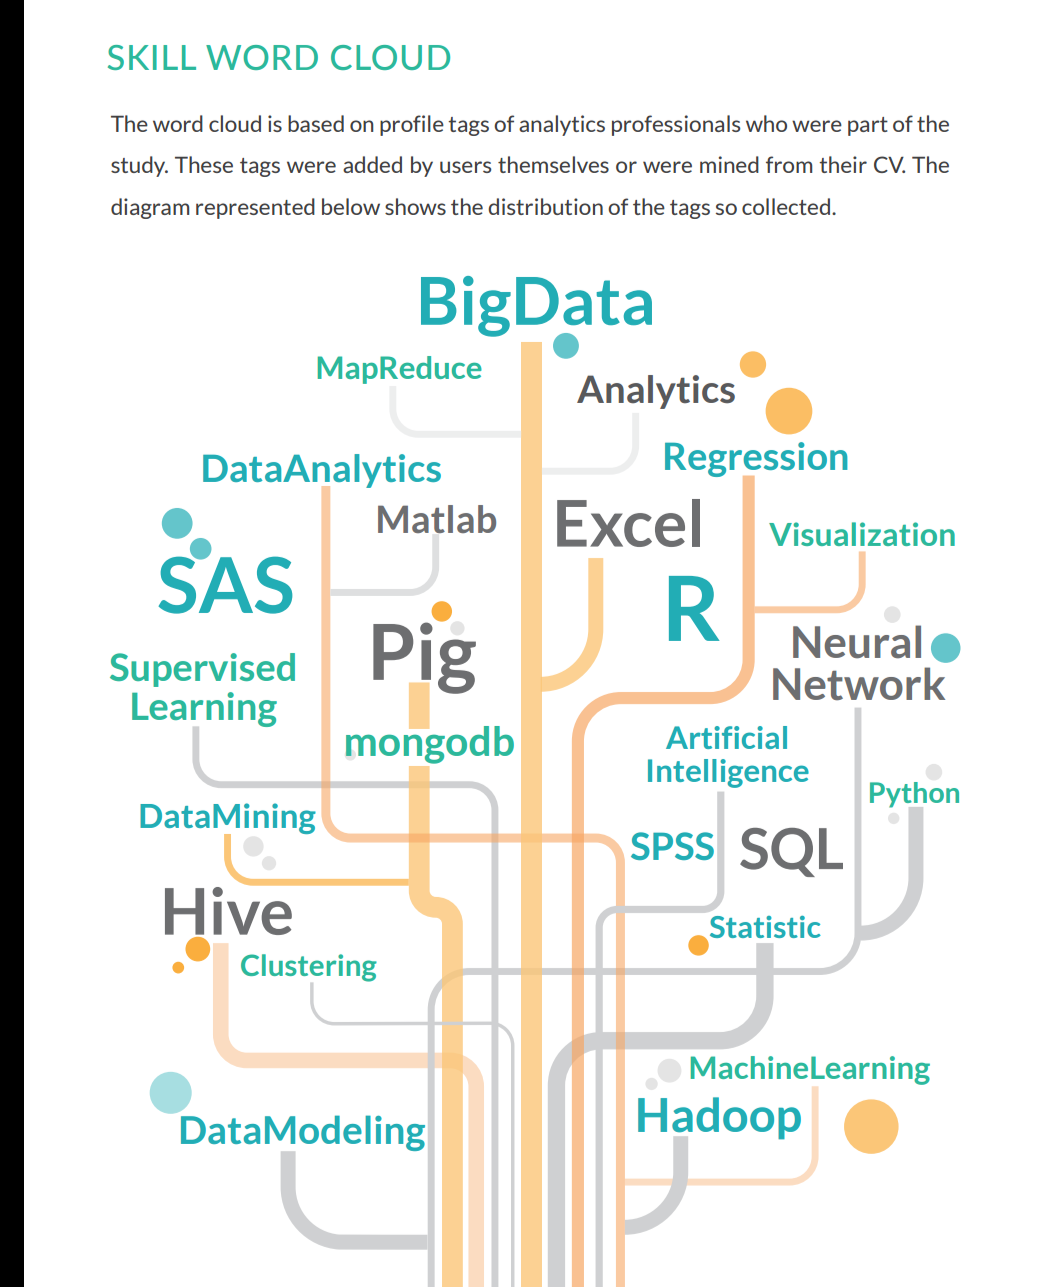
The report states that Machine Learning algorithms are dominating the business projects landscape with regression as the lone crusader fighting the battle for traditional statistical techniques. In fact, the top algorithms that organizations want people to pick up are Machine Learning ones.
This is not to say Big Data has lost any steam. Big Data Analytics roles have evolved and the last 18 months has seen some level of consolidation in terms of techniques and tool knowledge needed. As per the report, Hadoop skills, in combination with Spark and Tableau, and along with knowledge of popular databases like Mongo and Cassandra, makes for that rare big data unicorn. The analytics industry has always favoured people with knowledge of multiple tools and that still stands true. The industry is on the lookout for specialists in different areas of analytics who can work on a project end-to-end. Going by the report, this is the age of the analytics specialist.
Easy access to Big Data and massive processing power has made Machine Learning techniques more popular than ever amongst data scientists. Businesses now have learnt to harness the immense power of machine learning and are ready to put faith in abstract machine learning models that they probably don’t even understand.
Analytics, Big Data, and Machine Learning skills are making people stand out and get hired at handsome pay packages. It is time to pivot towards these for a future proof career.
The annual report by Jigsaw Academy and Analytics Vidhya is compiled to cater to the needs of aspirants, analytics professionals, and employers. Based on information collected from 65,000+ analytics professionals with advanced analytics/data science skills, the report explains in detail the industry and salary trends for the upcoming year.
Jigsaw Academy is a premier online analytics training institute headquartered in Bengaluru, India. Founded by the duo of Gaurav Vohra and Sarita Digumarti, and funded by Manipal Global Education Services [MaGE], Jigsaw Academy has helped over 45,000 students in 30+ countries to build a successful career in analytics with their specialized industry oriented courses. Jigsaw Academy has collaborated with two world class international universities viz. University of Chicago, USA and University of Bocconi, Italy to offer specialized blended learning certification programs. For more information, please visit JigSaw Academy
About Analytics Vidhya
Analytics Vidhya is India’s largest Analytics and Data Science community. They run a portal which helps people in learning data science, interact with industry experts, compete in hackathons, and find job opportunities in data science. Analytics Vidhya also conducts various meetups, webinars, and conference across the country. The aim behind this platform is to create a passionate community of analytics enthusiasts. For more information, please visit Analytics Vidhya
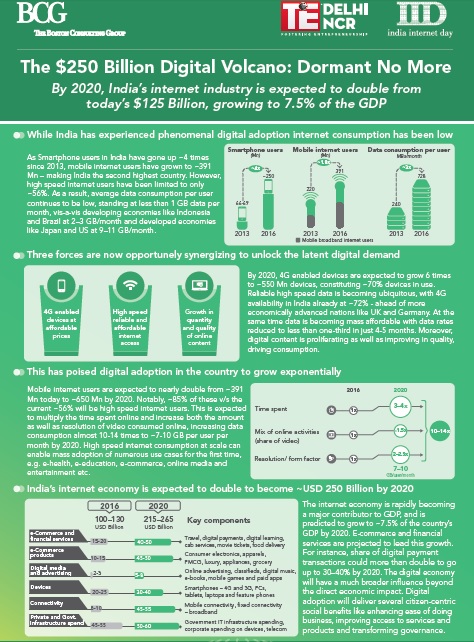
With around 391 million users, India has already become the second highest country in terms of mobile internet users. This is expected to grow rapidly to around 650 million mobile internet users by 2020. At the same time, data consumption by 2020 could potentially increase 10-14 times. The Boston Consulting Group [BCG], along with TiE, have released a report titled The $250 Billion Digital Volcano: Dormant No More that describes this phenomenal digital adoption in the country.
The impending digital salience can be seen from the following indicators:
High speed mobile internet adoption is set to reach ~550 Mn users by 2020, almost 85% of the total mobile internet users
Average data consumption is projected to reach ~7-10 GB per user per month by 2020
India’s internet economy is expected to double from USD 125 Bn to USD 250 Bn, growing from
the current ~5% to ~7.5% of the country’s GDP
The report reveals that while so far mobile internet users have proliferated and Smartphone users have gone up by 4 times, high speed internet users have still been limited only to ~56%. Thus, average data consumption per user continues to be low, standing at less than 1 GB data per month vis-a-vis developing economies like Indonesia and Brazil at 2–3 GB/month and developed economies like Japan and US at 9–11 GB/month. However, the situation is about to change.
Nimisha Jain, a BCG partner and report co-author said
It is essential to understand the three forces that are now synergizing to unlock internet consumption in India. Firstly, by 2020, 4G enabled devices are expected to grow 6 times to 550 Mn devices, constituting 70% devices in use. Secondly, reliable high speed data is becoming both ubiquitous as well as mass affordable (data rates have reduced to less than one-third in just 4–5 months). Lastly, digital content is proliferating as well as improving in quality, thus driving consumption.
Increased high speed internet adoption, the report says, is expected to increase time spent online by 2020 to almost 3-4 times. Moreover, the amount of video consumed online is on the rise especially driven by online media and entertainment. As internet access ceases to be a constraint, consumers will become more quality conscious, resulting in an increase in the average video resolution. Driven by these changes in online consumption, average data consumption per user is set to increase by 10-14 times by 2020.
The report comes at a time, when the conversation has moved from ‘Internet of Things’ to ‘Internet of Everything’, and digitization presents a great opportunity for multiple stakeholders. Innovation is what leads to sustainability, and sustainable growth in the current entrepreneurship ecosystem will enable India to chart its own success story.
India’s internet economy is expected to double to become USD 250 billion by 2020. E-commerce and financial services are projected to lead this growth. For instance, share of digital payment transactions could more than double to go up to 30–40% by 2020. Digital economy will have a much broader influence beyond the direct economic impact. Digital adoption will deliver several citizen-centric social benefits like enhancing ease of doing business, improving access to services and products and transforming governance.
As the new digital paradigm emerges, adapting to change will become critical. For instance the impact on jobs is expected to be transformational. Increased automation will minimize manual and repetitive roles while roles in upcoming spaces become coveted, e.g. Human-machine interaction. Existing roles will also undergo transformation as low-value adding tasks get automated. New ways of working are expected to emerge with an increasingly flexible workforce optimizing for efficiency. At the same time, genesis of new technology-led business models will give impetus to entrepreneurial activity and create new opportunities.
About India Internet Day
India Internet Day is a leadership conference that looks at setting conversations around a long term vision for the industry. The idea of India Internet Day is to look at paradigm shifts in the internet industry globally and what that means for the internet business in India. While based in India, the event seeks to have a strong global connect. The forum also explores the shape of things to come while connecting with the established players, outliers and experimenters – making the forum as a point of reference. In this our fifth year, #iDay2017 goes beyond the predefined boundaries and explore issues of far more relevance and impact. For more information, please visit India Internet Day
Flurry Analytics, division of Yahoo announced the findings for State of the App Nation in India – the study uncovers insights around mobile app activity and their usage, emerging growth categories & device adoption trends in India.
The State of the App Nation in India study is backed by data gleaned from over 940,000 applications, across 2.1 billion global devices from across the world, and the 58,000 apps, across 147 million devices from India, that use Flurry.
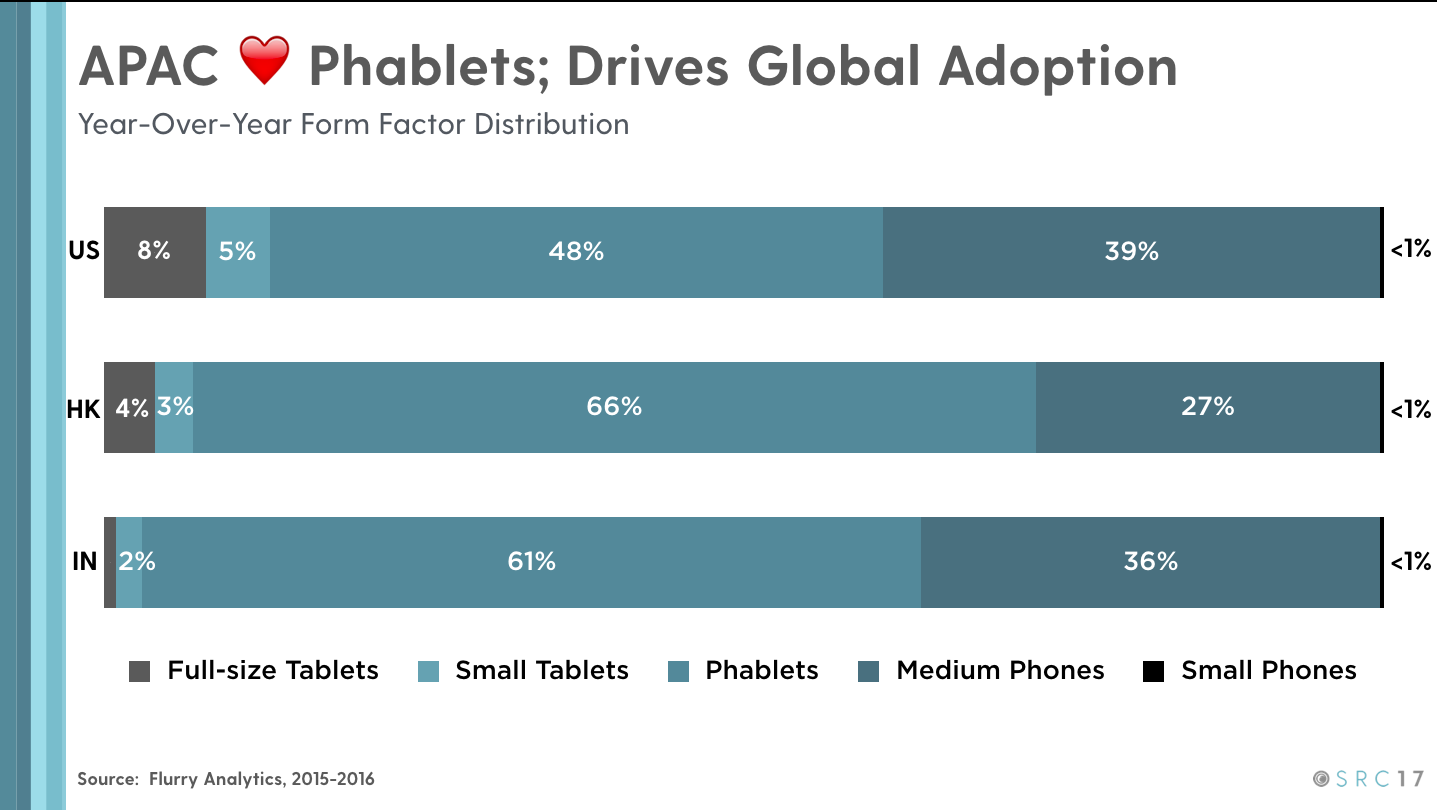
The trends show Asia and India leading the phablet revolution. The phablet [devices with screens between 5″ and 6.9″] is the fastest growing mobile device globally. In India, phablets have a market share of 61%, outpacing growth in the US which has 48% market share. When looking into the mobile usage in India, one major trend emerged – India’s mobile usage looks a lot like global usage did six months ago, still ascending on the growth curve but not at the rate we saw the year prior.
Presenting the study in Bangalore, Christopher Klotzbach, Director, Flurry from Yahoo said
As smartphones celebrate their first decade; the mobile app industry has grown into a dog-eat-dog world. The decelerating rate of global growth could signal market maturity, saturation or simply the end of the app gold rush. Going back to India’s six-month mobile trend delay, there is no better time for local developers to innovate, and lessen or possibly stop a local industry pause. We are excited to see what app developers do in the next decade and watch which industry they chose to disrupt, again.
Key Insights and Trends from Flurry : State of the App Nation in India
Note : All data as measured by Flurry YoY from 2015~2016
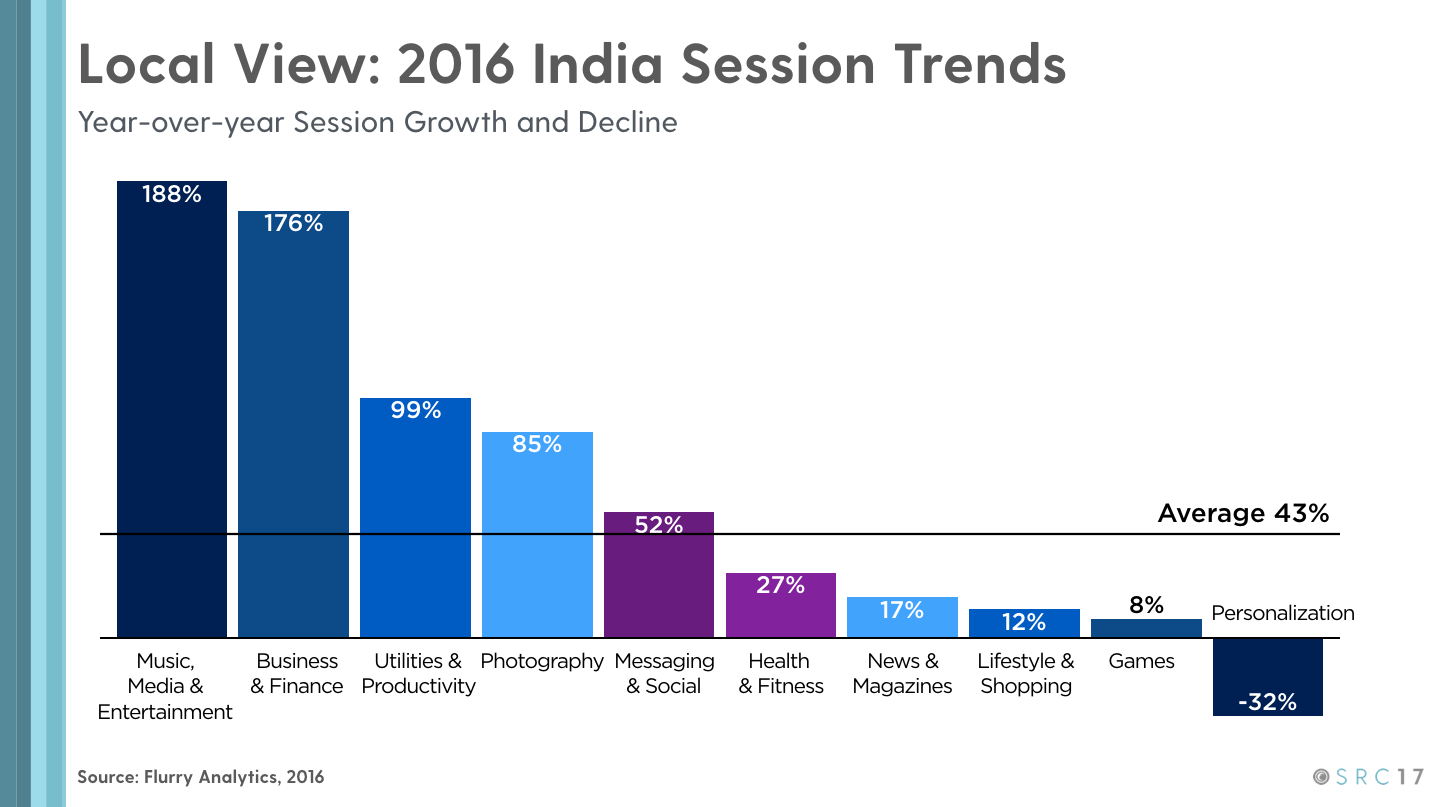
India’s app usage grew 43% YoY: The India app usage grew at 92% during the same period last year (2015).
Asia and India are leading the phablet revolution:Indian mobile consumers are phablet lovers, with the form factor size securing 61% of the market share in India. This footprint is also the driving force behind global adoption figures.
Diversification of apps : App categories seeing the fastest growth in India
The top 3 app growth categories in India are Music, Media and Entertainment followed by Business and Finance apps, and Utilities and Productivity apps.
Music, Media and Entertainment applications saw the biggest usage increase at 188% YOY, which can be attributed to rise of phablet devices and better Internet connectivity in India.
Business and Finance apps grew 176% YoY.
Utilities and Productivity apps grew 99% YoY
Messaging and social apps remain one of the most engaged categories in Asia and India: Time spent in Messaging and Social apps grew by an impressive 52% in India and 44% globally.
Personalization apps see decline: Much like the global trends, Personalization apps saw the biggest usage decrease at -32%. This decrease is due to operating systems integrating the functionality of these apps natively.
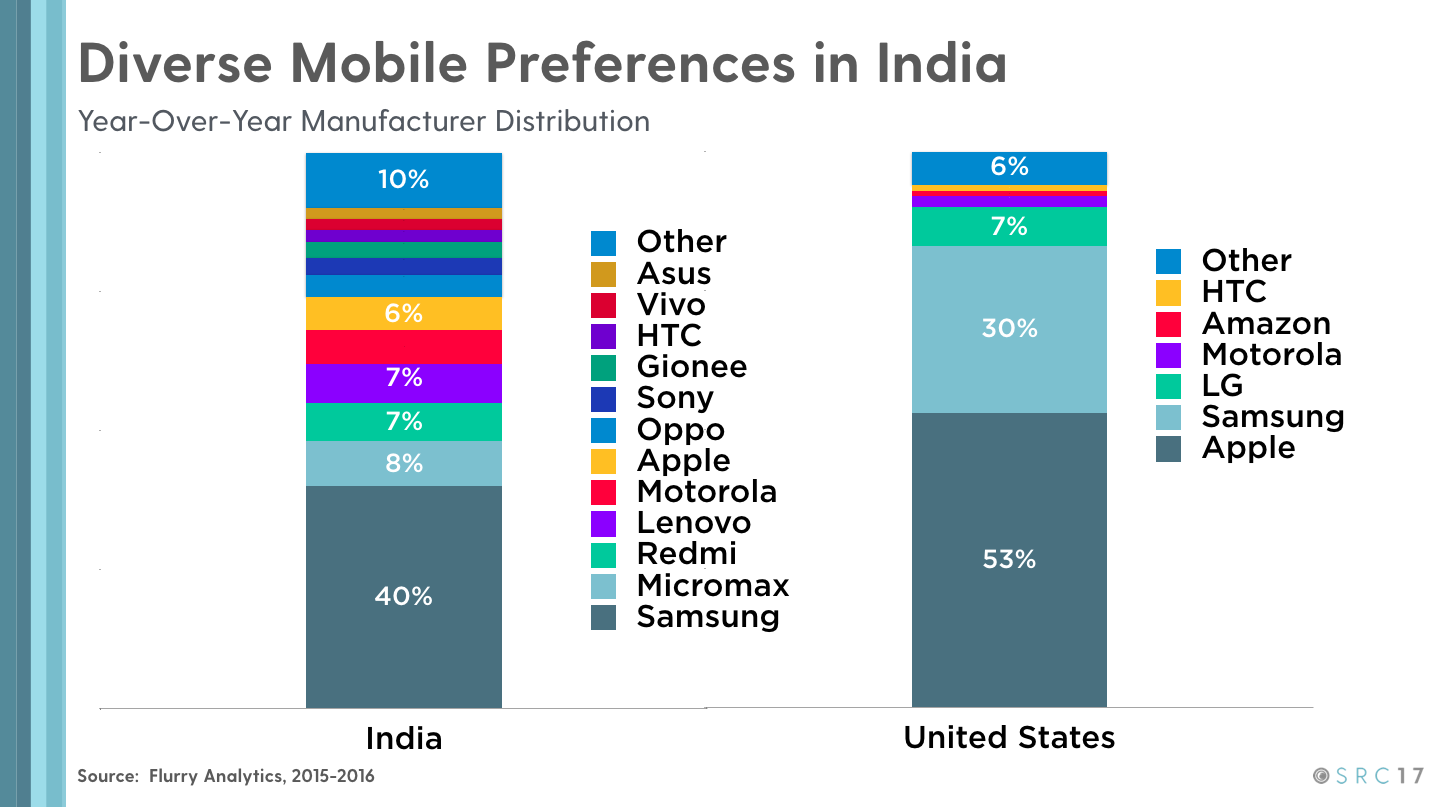
Indian mobile consumers have very diverse tastes while selecting their mobile manufacturer: More than 12 mobile makers have a substantial footprint locally with Samsung leading with 40% market share, followed by brands like Micromax, Redmi and Lenovo. This is an interesting phenomenon, compared to mobile manufacturer popularity globally where on average there are about six major mobile manufacturers.
Sticky Apps Tied to Daily Habits:Some of the most successful app categories throughout the years have tapped into the mobile addict population. They are also apps that rely on live data, such as Business and Finance [up 43% globally in time-spent; up 176% in India].
Interestingly in India, this trend is best seen in Health and Fitness app usage [up 27% locally]. These apps see high hourly engagement throughout the day, as users turn to their mobile and wearable devices to track their fitness goals and progress.
Shopping Apps Spell the Doom and Gloom of Brick and Mortars: In 2016, shopping apps continued to gain popularity, growing 31% globally and 12% in India.
Video Killed the Gaming Star: Gaming, the app category known as ‘the darling of the mobile industry’, saw time-spent decline by 4% globally and a small growth in India of just 8%.
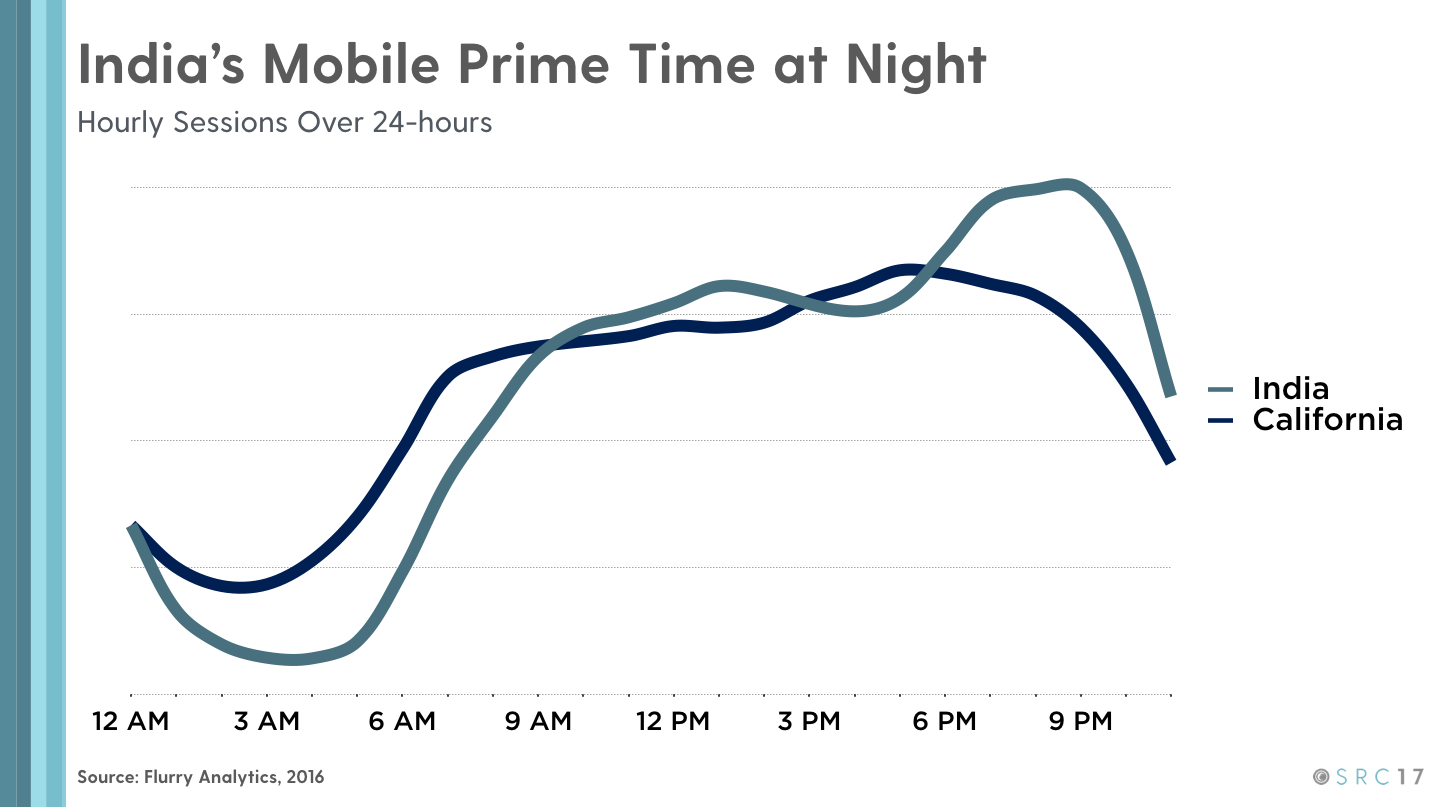
Mobile consumers in India are night owls: With peak usage rolling in around 9 PM. Indian users are generally slower to turn to their phones in the morning but quickly scale usage throughout the later morning hours.
Top Global Trends
The burgeoning trend of ‘Communitainment’ (or, social sharing of media) is driving mobile consumers to spend more than 2 hours/day on Social and Messaging apps.
The average mobile consumer spends just under 5 hours a day on their smartphones.
Shopping applications saw over 17 billion sessions in 2016; effectively changing retail window shoppers into mobile impulse buyers.
Compared to 2015, global app usage grew by 11% in 2016. In previous years, we’ve seen all app categories grow in tandem; however, for 2016 year the story is different. In 2016 mobile apps started eating their own, with session and time-spent growth in some app categories occurring at the expense of others. While Messaging and Social apps use rose year-over-year by 44%, Personalization apps (like emoji keyboards) declined by 46%.
About Flurry
Flurry is an industry-leading mobile analytics, monetization and advertising platform. With Flurry, developers and marketers can analyze user interactions with mobile applications and advertise in-apps.
Flurry supports more than 250,000 developers, reaching more than 940,000 apps across more than 2.1 billion devices with 10 billion sessions every day. Flurry was acquired by Yahoo! in July 2014. For more information on Flurry, visit developer.yahoo.com or the Flurry Insights blog
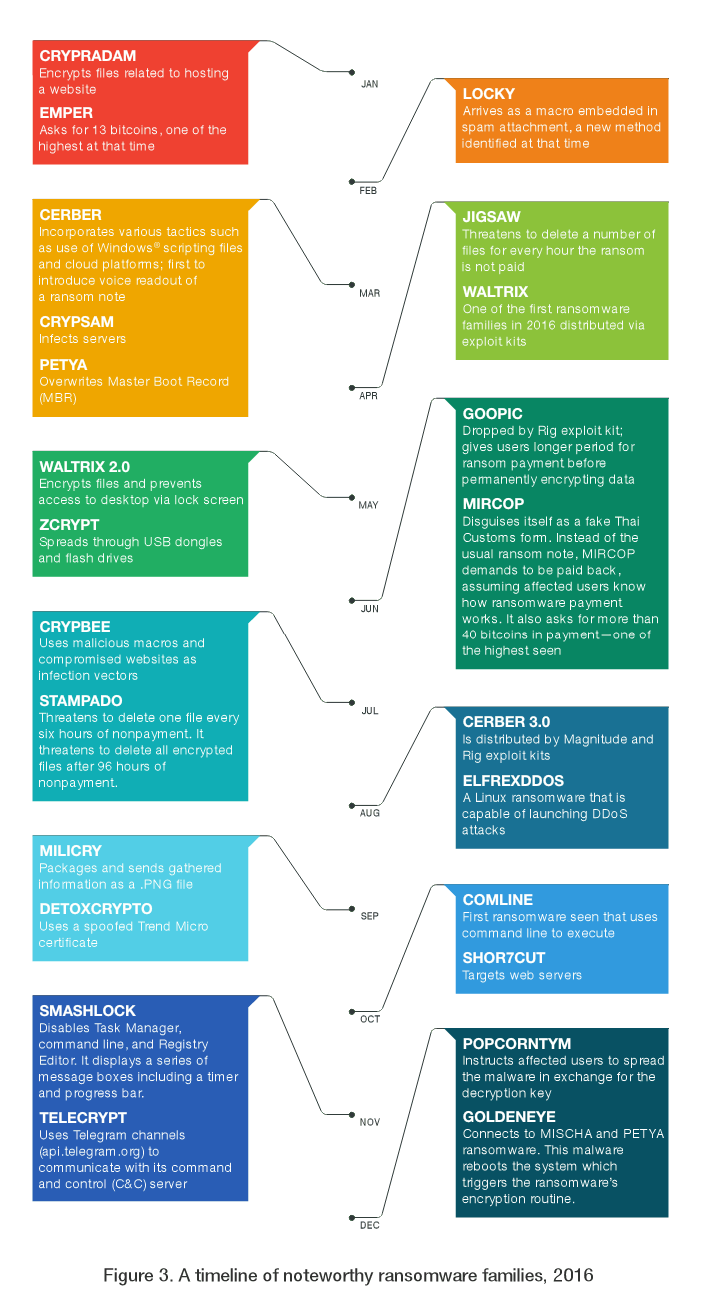
TrendMicro, a global leader in cybersecurity solutions, released its annual securityroundup report, 2016SecurityRoundup : A Record Year for Enterprise Threatswhich proves 2016 was truly the year of online extortion. Cyber threats reached an all-time high in 2016, with ransom-ware and Business Email Compromise [BEC] scams gaining increased popularity among cyber-criminals looking to extort enterprises. A 752percentincrease in new ransom-ware families ultimately resulted in USD 1 billion in losses for enterprises worldwide.
TrendMicro and the Zero Day Initiative [ZDI] discovered 765 vulnerabilities in 2016. Of these, 678 were brought to ZDI through their bug bounty program, then ZDI verifies and discloses the issue to the affected vendor. Compared to vulnerabilities discovered by TrendMicro and ZDI in 2015, Apple saw a 145 percentincrease in vulnerabilities, while Microsoft bugs decreased by 47 percent. Additionally, the use of new vulnerabilities in exploit kits dropped by 71 percent, which is partially due to the arrest of the threat actors behind Angler that took place in June 2016.
In 2016, the TrendMicro Smart Protection Network blocked more than 81 billion threats for the entire year, which is a 56 percentincrease from 2015. In the second half of 2016, more than 3,000 attacks per second were blocked for customers. During this time, 75 billion of blocked attempts were email based, illustrating that email remains the top entry point for threats.
Report highlights
Growth of Ransomware – Throughout the course of 12 months, the number of ransomware families grew from 29 to 247. One leading factor to explain this increase is the profitability of ransomware. Although individuals and organizations are encouraged not to pay the ransom, cyber-criminals still managed to rake in roughly USD 1 billion last year.
BEC Scams on the Rise – Much like ransomware, BEC scams proved to be incredibly lucrative for cyber-criminals, resulting in an average of USD 140,000 in losses for companies around the globe. These scams also highlighted the effectiveness of social engineering techniques for threat actors targeting enterprises.
A Variety of Vulnerabilities – TrendMicro and the Zero Day Initiative [ZDI] discovered a record high number of vulnerabilities in 2016, most of which were found in Adobe Acrobat Reader DC and Advantech’s WebAccess. Both applications are widely used throughout enterprise and Supervisory Control and Data Acquisition [SCADA] systems.
Angler Exploit’s Exit – Following the arrest of 50 cyber-criminals, the once dominant Angler exploit kit slowly faded out of the spotlight until it ceased to exist. While it didn’t take long for new exploit kits to burst onto the scene in Angler’s absence, by the end of 2016, the amount of vulnerabilities included in exploit kits had decreased by 71 percent.
Banking Trojans and ATM Malware – Cyber-criminals have been using ATM malware, skimming cards and banking Trojans for a while now. However, the attacks have diversified in recent years, giving threat actors access to Personally Identifiable Information [PII] and credentials, which can also be used to gain a foothold inside enterprise networks.
Mirai’s Massive Attack – In October 2016, attackers took advantage of poorly secured IoT devices to issue a distributed denial-of-service [DDoS] attack that hijacked approximately 100,000 IoT devices and forced websites such as Twitter, Reddit and Spotify to go offline for several hours.
Yahoo’s History Making Data Breach – Yahoo experienced the largest data breach in history in August 2013, compromising 1 billion account users’ information. However, the incident was not disclosed until three months after reports of a separate data breach in September 2016, which involved 500 million more accounts. These events stirred up the responsible disclosure conversation and the accountability companies have to their customers regarding the security of user data.